About Me
👋 Hey, I'm Vishnu!
AI Engineer @ Kivane Tech | Specializing in Applied Machine Learning & AI SolutionsI design and build scalable, real-world AI systems that solve business problems not just in theory, but in production. From fine-tuning LLMs to deploying AI agents and building intelligent pipelines, I’m passionate about making machine learning practical, reliable, and impactful.💡 What I Bring to the Table:Proficient in Python, LLMs, and AI agents with a strong focus on real-world applications and performance at scale.Experienced in bridging the gap between R&D and deployment turning cutting-edge models into usable solutions that drive results.Skilled in translating complex AI concepts into business value. I believe AI should solve problems, not just impress with buzzwords.Continuously expanding my toolkit in areas like prompt engineering, vector search, and MLOps to stay ahead in the rapidly evolving AI landscape.⚡ My Superpower?
Merging deep technical expertise with a product-driven mindset. I focus on building AI systems that work systems that align with business goals, user needs, and operational realities.⚽ Off the Clock:
You’ll still find me on the soccer field or backing Manchester United (through thick and thin). Data, football, and a bit of code that’s my game plan.🚀 Let’s Connect!
Whether you’re building with AI, solving complex business challenges, or just want to talk models and matches, I’m all ears. Let’s create AI that actually delivers.
Experience
Skills

Power BI | Excel | Tableau | SQL | Azure |Python | AWS | Salesforce
SQL - 5 years
Excel - 4 years
Python - 4 years
Power BI - 3 years
Data Analytics - 3 years
Database Modeling - 3 years
ETL Development - 3 years
Apache Airflow - 3 years
Predictive Analytics - 3 years
Machine Learning - 3 years
Salesforce - 2 years
Tableau - 2 years
Docker - 2 years
LLMs/RAG - 1 year
AWS - 1 year
ChromaDB - 1 year
Azure - 1 year
Gen AI - 1 year
The listed experience reflects practical, hands-on involvement, not solely formal work experience
Featured Projects
Streamlit, Python, Tensorflow, librosa
AI-Powered Music Genre Classification System
A machine learning application that analyzes audio files to classify music genres. Using advanced audio feature extraction and multiple ML models, it provides real-time genre predictions through an intuitive Streamlit interface.
SQL
patient-centric healthcare database
This ER diagram represents a patient-centric healthcare database, capturing patient demographics, medical history (procedures, medications, allergies, immunizations), and geographic data, with standardized reference tables ensuring consistency, scalability, and compliance.
Medium Blogs
Certifications

Microsoft Certified Power BI Data Analyst PL -300

Python for Data Science, AI and Development

HackerRank Advanced SQL Certification
Code Explanation & Translation with Local AI
Tools: Streamlit, Python, Mistral
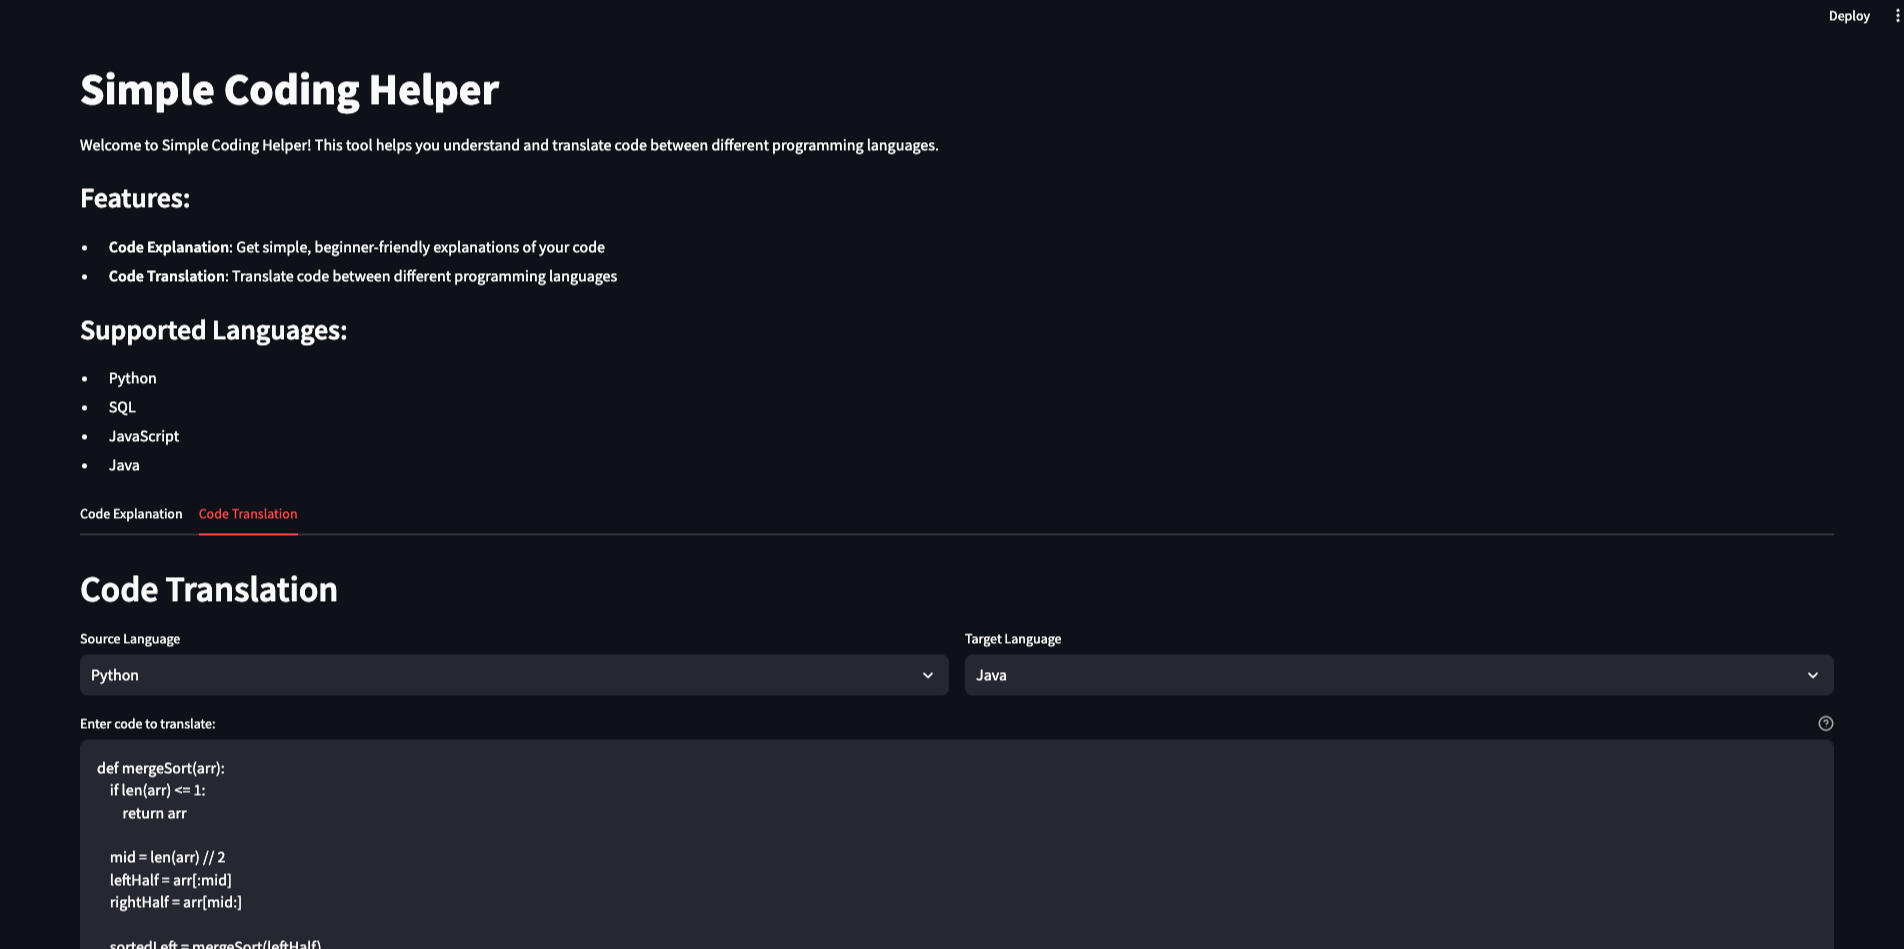
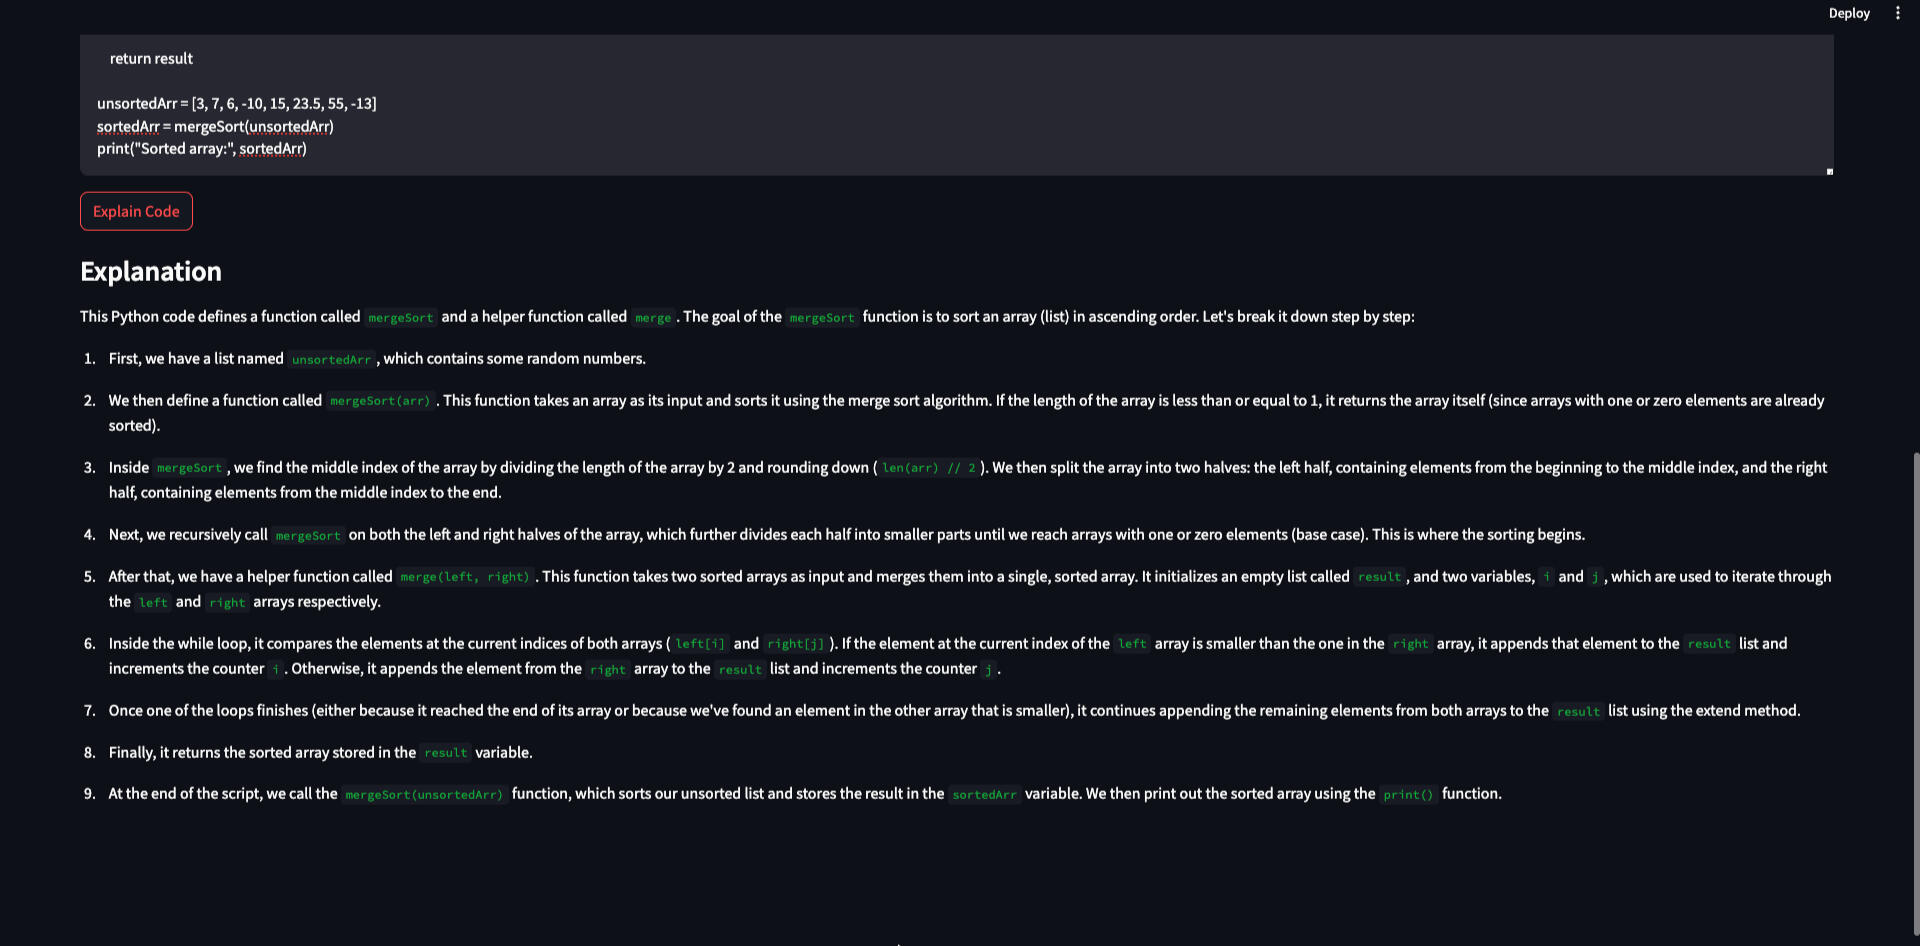
GitHub LinkProject SummarySimple Coding Helper is a lightweight, privacy-focused web application built with Streamlit that helps users explain and translate code across multiple programming languages using a locally hosted Ollama model. Designed for learners, developers, and educators, the app supports a variety of languages including Python, JavaScript, SQL, Java, C++, HTML, CSS, Ruby, PHP, and Go.Unlike cloud-based tools, Simple Coding Helper runs entirely on your machine, ensuring offline functionality and data privacy. Users can choose between two main modes:Explain Code – Paste a snippet to get a plain-language explanation.Translate Code – Convert code from one programming language to another.The app features a clean, intuitive interface where users can input their code, select languages, and instantly get results powered by the local Ollama LLM.The backend logic is modular, with separate components for language handling, model communication, and UI control. This structure makes it easy to maintain, extend, or integrate with other tools.Ideal for code learners, bootcamp students, and professionals working in secure environments, Simple Coding Helper combines the power of AI with the convenience of local processing.It’s open-source, customizable, and ready to run on any system with Python and Ollama installed.
AI-Powered Music Genre Classification
Tools: Streamlit, Python, Tensorflow, librosa
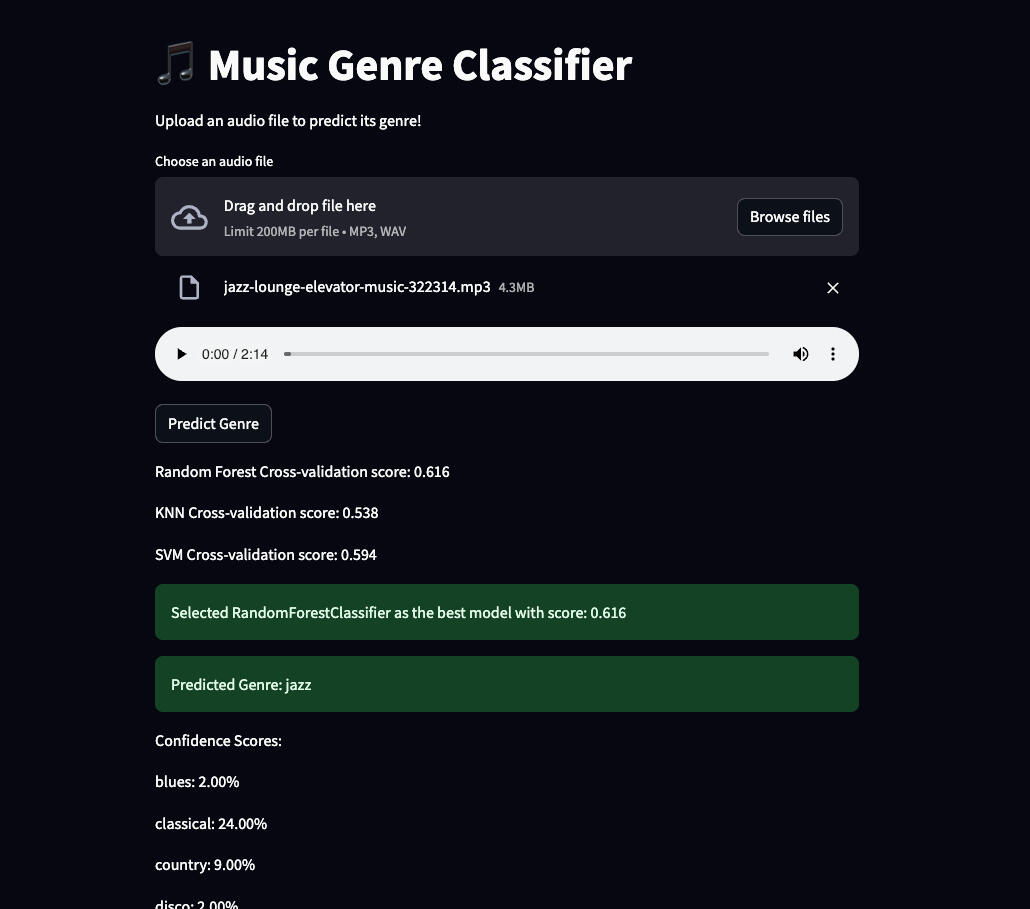
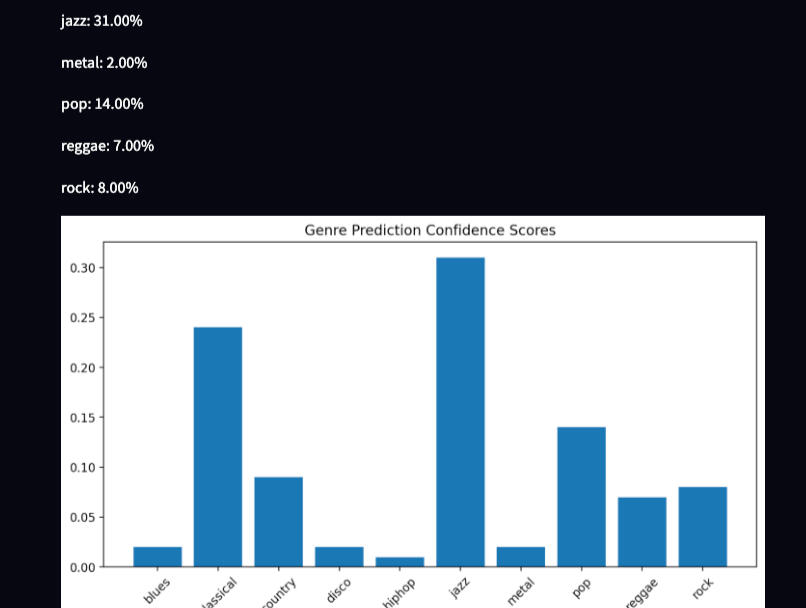
GitHub LinkMusic Genre Classification Project SummaryProject Overview
This is a machine learning-based music genre classification system that uses audio features to predict the genre of music files. The project implements a user-friendly Streamlit web interface for easy interaction.
Technical Components1. Core Features
Audio Feature Extraction: The system extracts multiple audio features including:
Basic properties (length, tempo)
Spectral features (chromastft, spectralcentroid)
MFCC (Mel-frequency cepstral coefficients)
Other audio characteristics (rolloff, zero crossing rate)2. Machine Learning Implementation
Model Selection: The system evaluates multiple classifiers:
Random Forest
K-Nearest Neighbors (KNN)
Support Vector Machine (SVM)
Feature Processing:
Standardization of features using StandardScaler
Cross-validation for model evaluation
Automatic selection of the best performing model3. User Interface
Built with Streamlit
Features:
- Audio file upload capability
- Real-time feature extraction
- Genre prediction display
- Model performance metrics
- Project Structure
- Apply to app.py
- Documentation
- DependenciesHow to Use
Install dependencies: pip install -r requirements.txt
Run the application: streamlit run app.py
Access the web interface at http://localhost:8501
Upload an audio file for genre classificationCurrent Status
The application is successfully running and accessible via:
Local URL: http://localhost:8501
Network URL: http://10.0.0.145:8501Technical Notes
The system uses a 30-second segment dataset for training
Features are extracted in a consistent order to match the training data
The model is retrained on each run (could be optimized by saving pre-trained models)
Cross-validation is used to ensure robust model performance
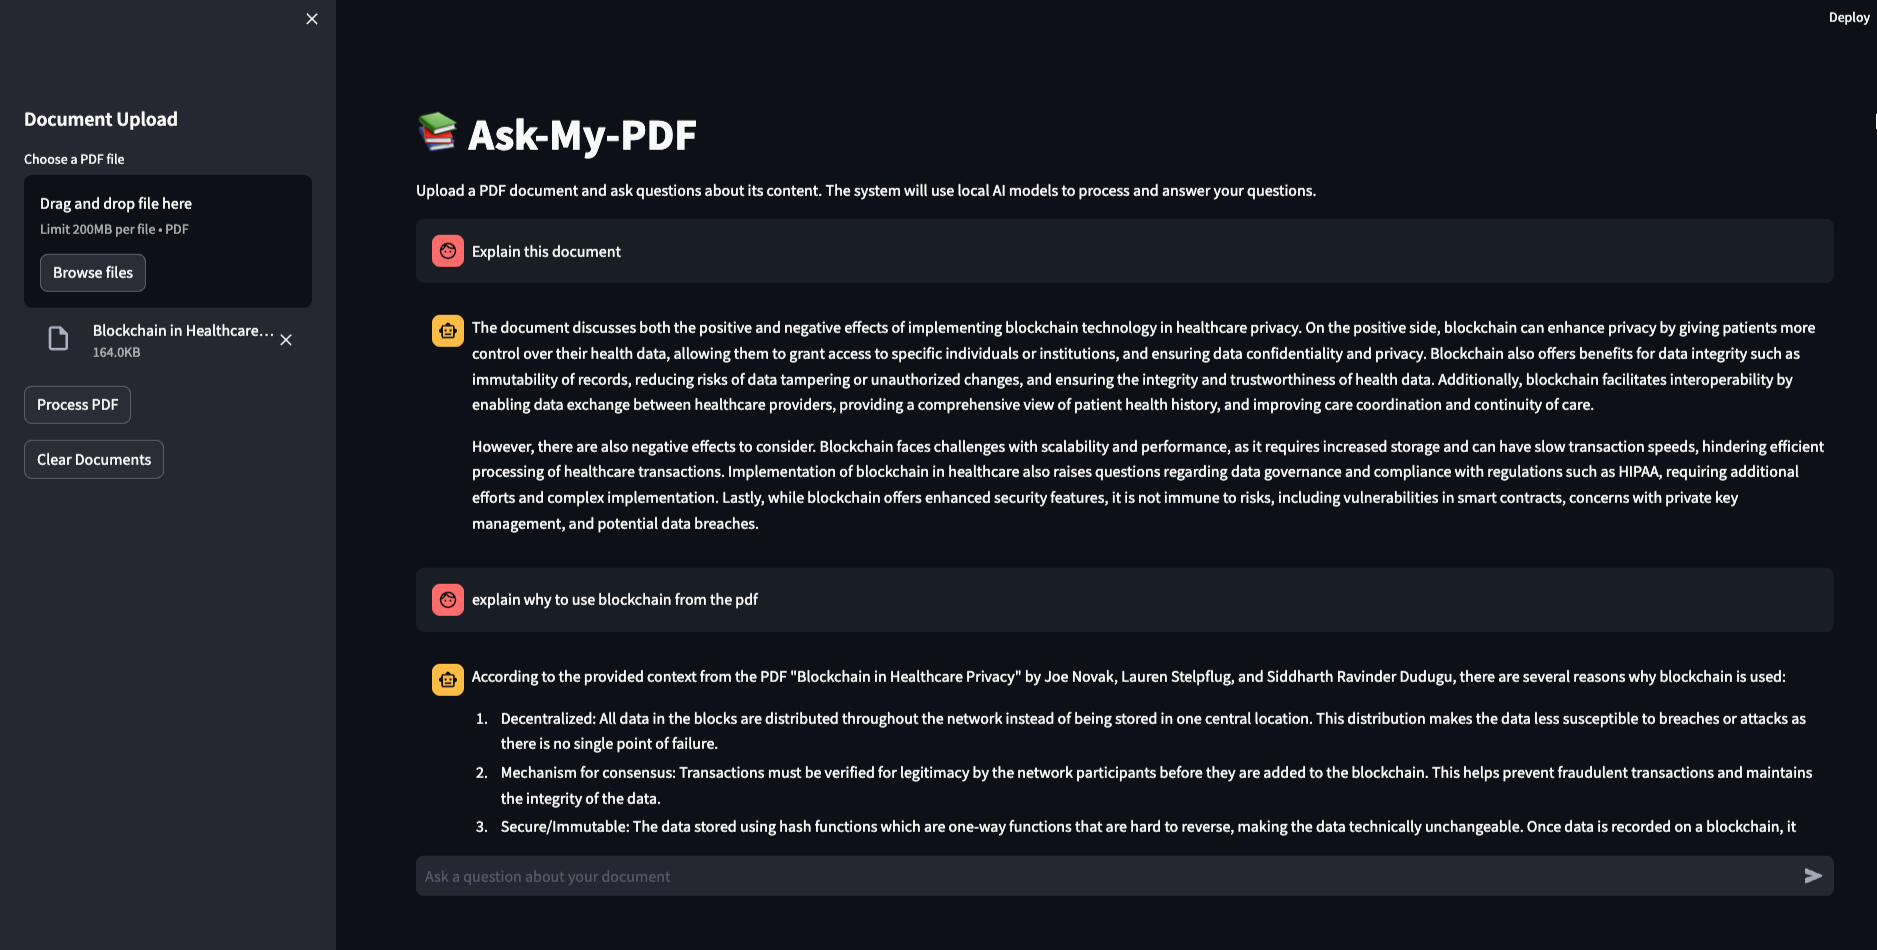
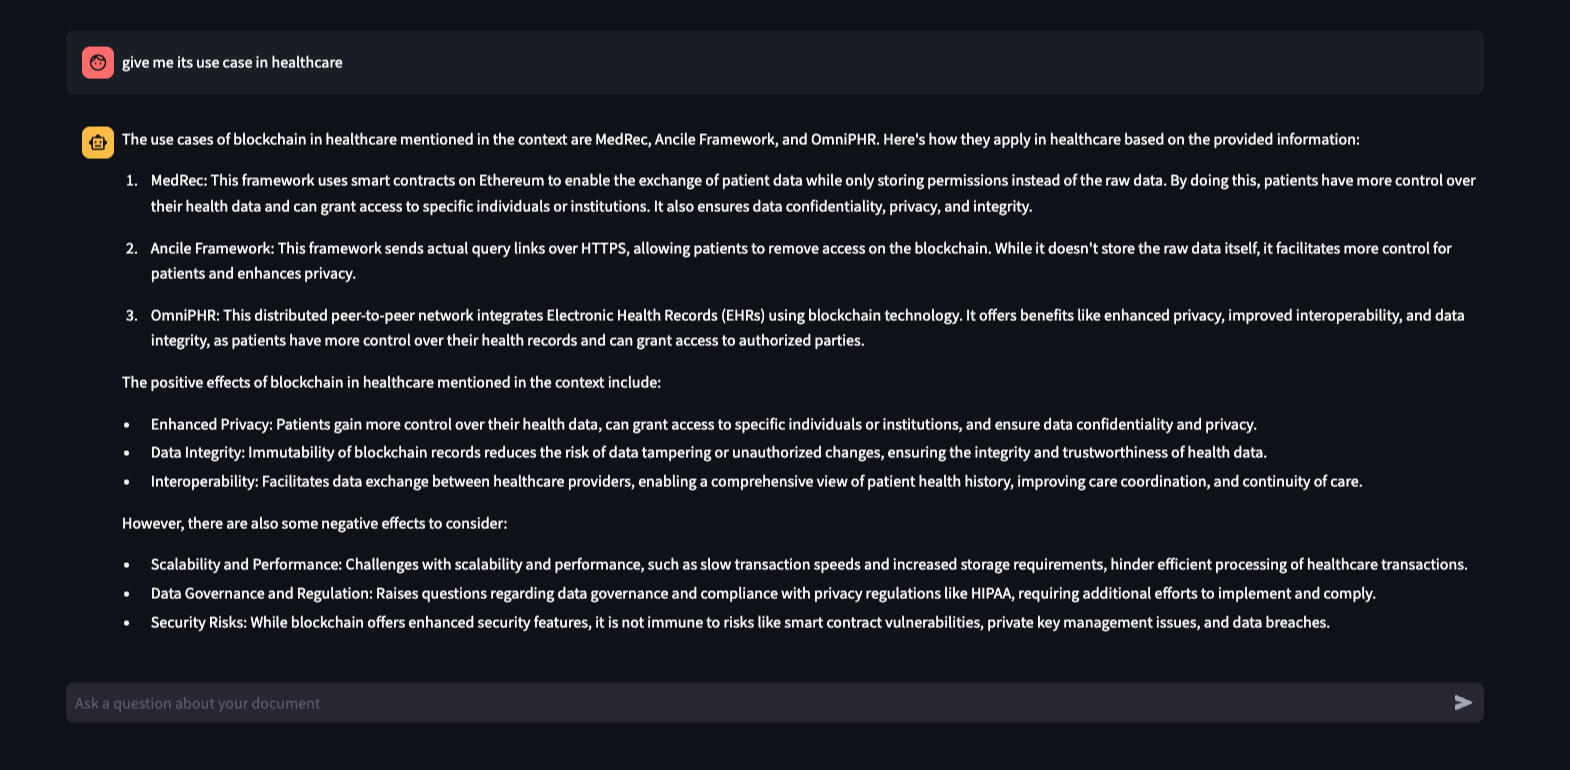
PDF-based QA Chatbot
Tools: Mistral, streamlit, python, RAG, ChromaDB, LLM
GitHub LinkProject Summary
This is a PDF document analysis and question-answering system that combines several modern technologies:1. Frontend: Built with Streamlit, providing a user-friendly web interface
2. Backend: FastAPI server handling PDF processing and question answering
3. Core Components:
- RAG (Retrieval Augmented Generation) system for document processing
- Vector database (ChromaDB) for storing and retrieving document chunks
- Local Mistral-7B model for generating responses
- Sentence transformers for text embeddingsWorkflow1. Document Upload and Processing:
- User uploads a PDF document through the Streamlit interface
- The backend receives the file and processes it using PyPDF2
- The document is split into chunks for efficient processing
- Each chunk is converted into embeddings using sentence transformers
- The embeddings are stored in ChromaDB with metadata2. Question Answering Process:
- User submits a question through the frontend
- The question is converted into an embedding
- The system retrieves the most relevant document chunks using cosine similarity
- Retrieved chunks are formatted into context
- The context and question are sent to the Mistral model
- The model generates a response based on the context
- The answer is returned to the user through the frontend3. Document Management:
- The system maintains a single active document at a time
- When a new document is uploaded, it replaces the previous one
- Users can clear all documents using the clear function
- The vector store is updated accordinglyKey Features1. Document Isolation: Each new document upload replaces the previous one, ensuring answers come only from the currently active document.2. Efficient Processing:
- Uses chunking for better memory management
- Implements vector similarity search for relevant content retrieval
- Employs local model inference for privacy and speed3. User Interface:
- Simple upload mechanism for PDFs
- Real-time question answering
- Clear document functionality
- Health check endpoints for system monitoringTechnical Implementation1. Backend Structure:
- main.py: FastAPI application with endpoints for upload, questions, and health checks
- rag.py: RAG implementation for document processing and context retrieval
- db.py: Vector database management using ChromaDB
- llm.py: Local Mistral model integration for response generation2. Frontend Structure:
- Streamlit app with file upload, chat interface, and document management
- Configurable timeouts for long-running operations
- Error handling and user feedback3. Data Flow:User Upload → PDF Processing → Chunking → Embedding → Vector Store
User Question → Embedding → Similarity Search → Context Retrieval → LLM ResponseThis architecture provides a robust system for document analysis and question answering, with a focus on efficiency, accuracy, and user experience. The use of local models and vector storage ensures privacy and fast response times, while the modular design allows for easy maintenance and updates.
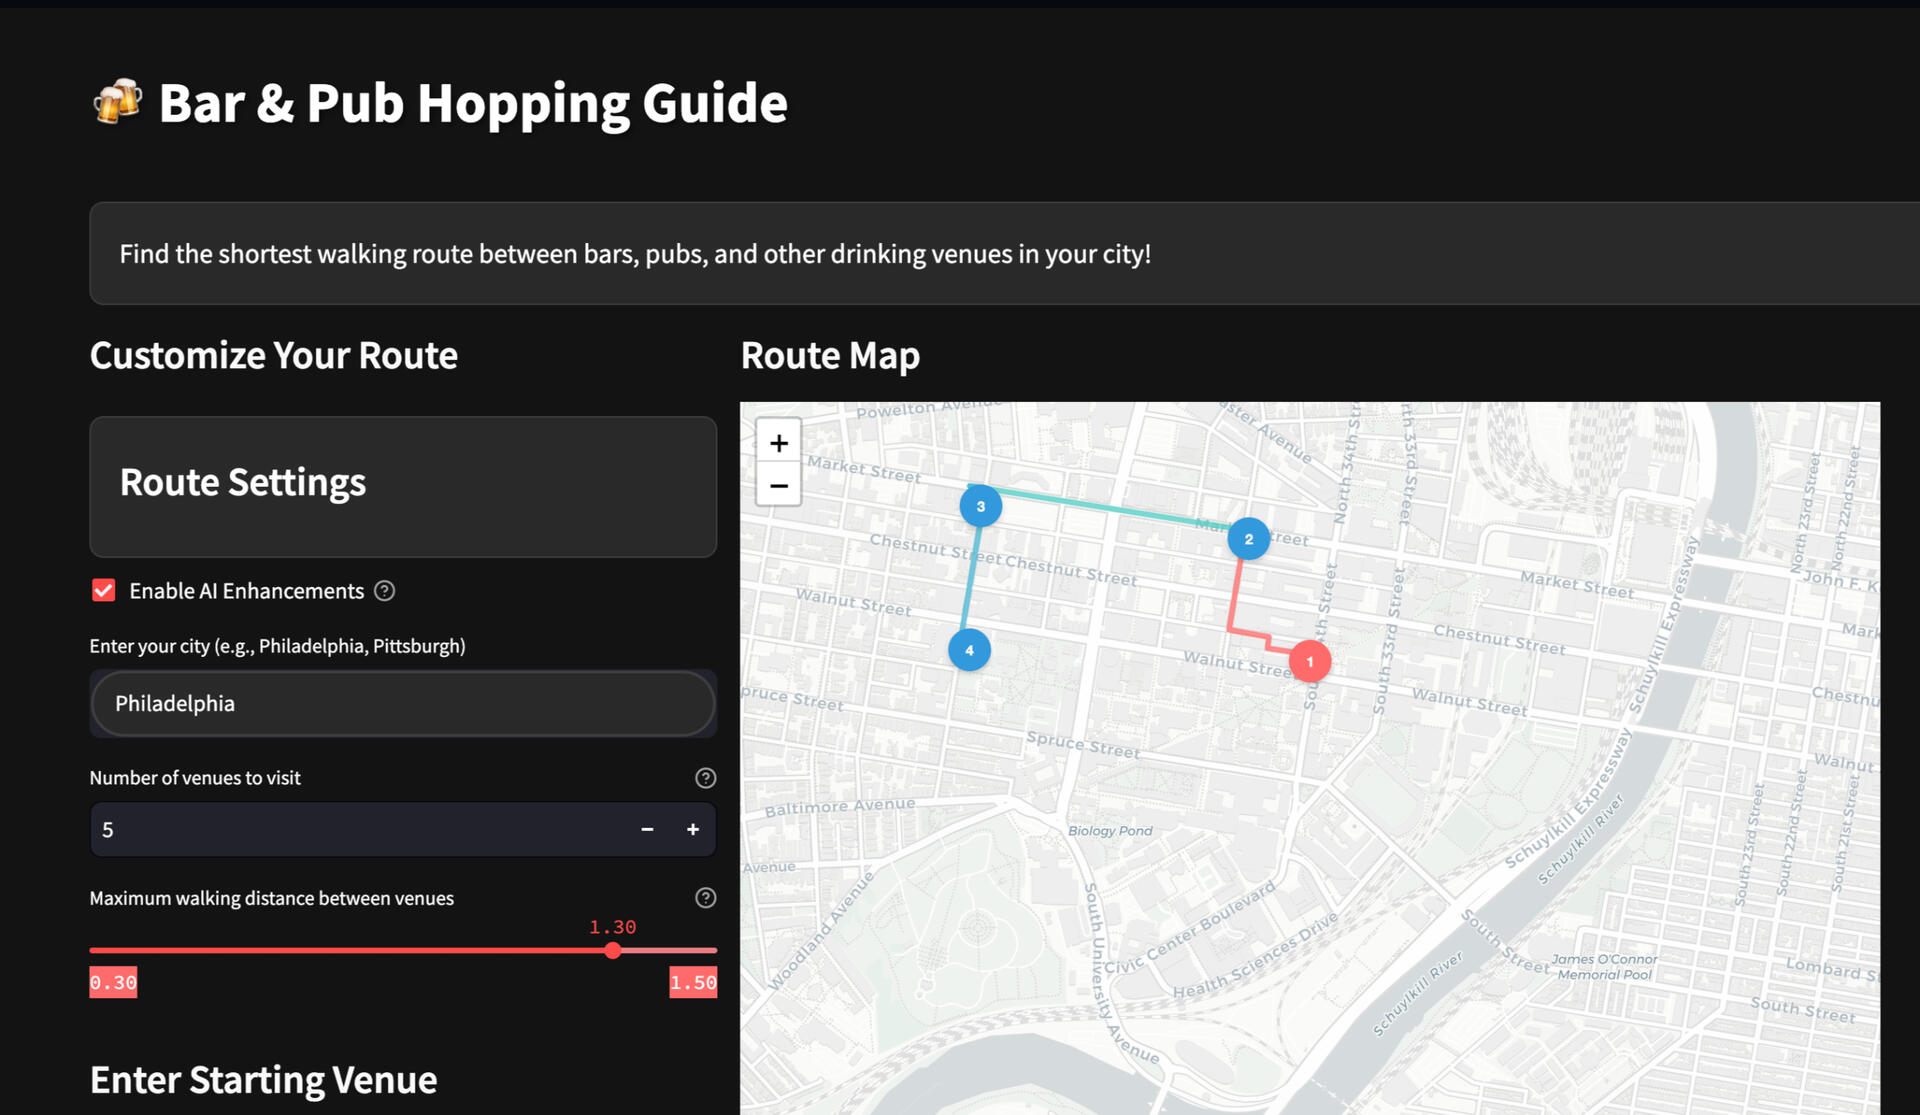
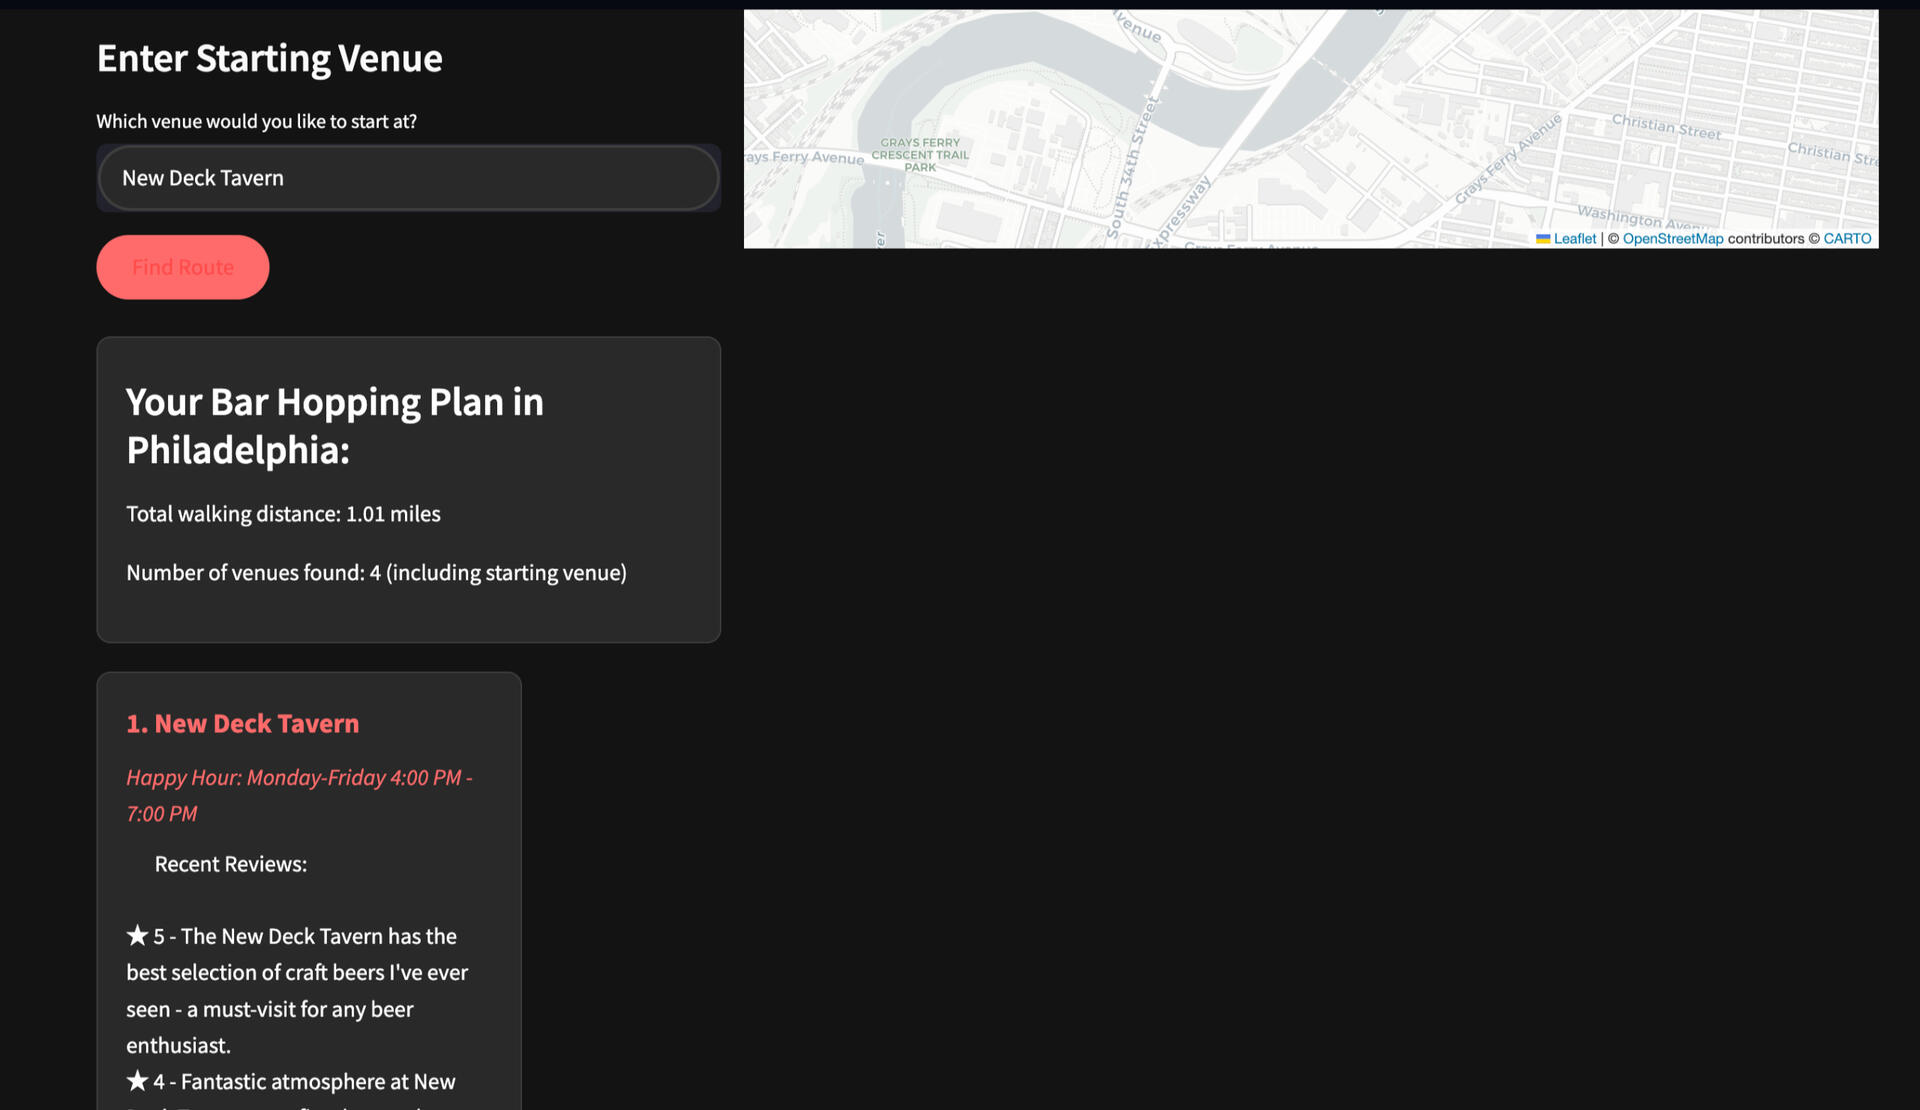
Bar Hopping Guide
Tools: Mistral, streamlit, python, geopy, folium, OSRM
GitHub LinkFile 1: ai_enhancements.py
This file defines a Python class called AIEnhancements that uses an AI model (named 'Mistral' from the fictitious 'Ollama' API) to generate realistic text enhancements for venue information.Key functionalities include:
- Text Generation: It sends requests to the Ollama API to generate realistic venue reviews and predict drink prices and happy hours based on the venue data provided.
- Error Handling: It has mechanisms to handle any errors that occur during the API requests, ensuring that the application can gracefully handle failures by providing fallback data.
- Data Enhancement: The class can enhance venue information with generated reviews and pricing details and apply these enhancements to an entire route of venues.Below we will explore some key functions within the app.py file:1. geocode_with_retry
This function attempts to convert an address into geographic coordinates using the Nominatim geocoder. It includes error handling and retry logic to manage common geocoding issues like timeouts. If initial attempts fail, it tries additional requests with exponential backoff, providing resilience against temporary service unavailability.2. calculate_distances_parallel
This function calculates the distances between all pairs of venues using multithreading to enhance performance. It utilizes Python’s concurrent.futures.ThreadPoolExecutor to perform these calculations in parallel, which is especially useful when processing a large number of venues to determine which ones are within a feasible walking distance.3. find_shortest_path
A key function in the route planning feature, this tries to find the shortest walking route that connects a specified number of venues without exceeding a maximum walking distance limit. It uses a recursive approach to explore different combinations of venues, filtering based on direct and walking distances to optimize the route.4. create_map
This function uses the Folium library to create an interactive map centered on a starting venue. It adds markers for each venue and draws lines representing the walking route between them. The function dynamically assigns colors to each route segment for better visual distinction and includes distance tooltips on each segment.5. main
The main function orchestrates the overall application flow in Streamlit. It sets up the user interface, handles user inputs (like city and venue choices), and invokes other functions to perform geocoding, find nearby venues, calculate routes, and display results. This function is where the application starts and manages interactions with the user.These functions are critical for the application’s capability to offer real-time, interactive route planning and mapping for users looking to optimize their bar-hopping experience.
Power BI
Flight Status Dashboard
Tools: Power BI, DAX, POWERQUERY
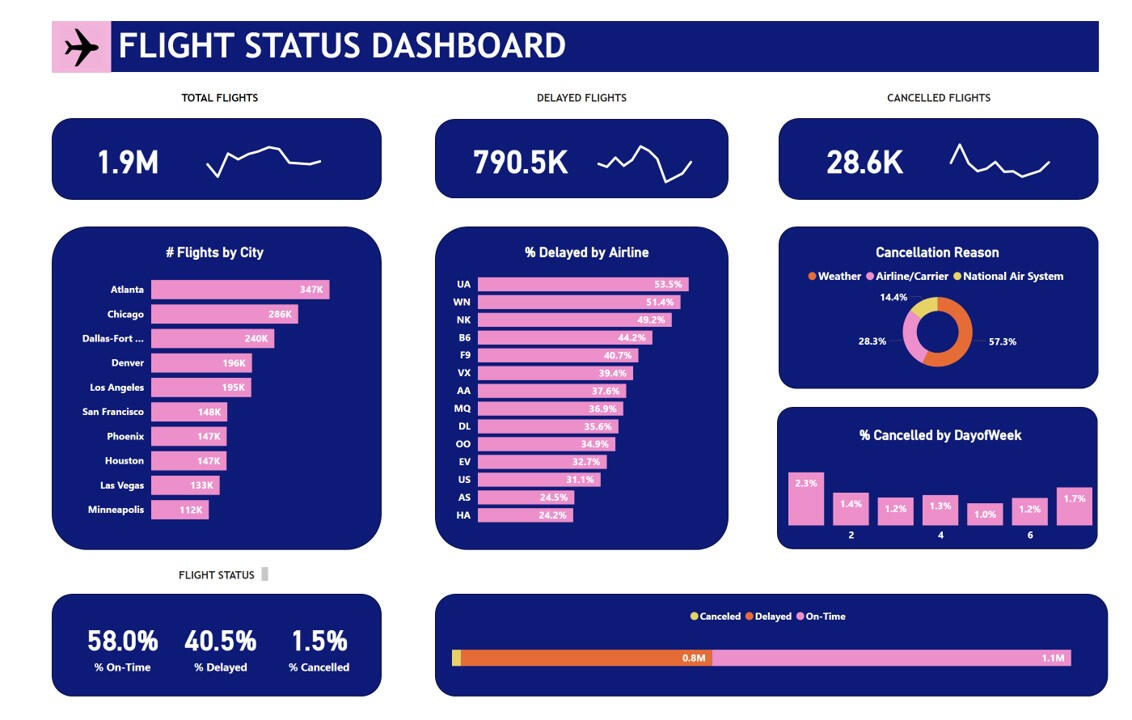
Dataset Link5 Key Questions:
1. Which cities have the highest flight volume?
2. What percentage of flights are delayed by different airlines?
3. What are the primary reasons for flight cancellations?
4. Which days of the week experience the most flight cancellations?
5. What is the overall breakdown of on-time, delayed, and cancelled flights?Here are my takeaways:1. The cities with the highest flight volume are Atlanta (347K flights), Chicago (286K flights), and Dallas-Fort Worth (240K flights). These major hubs handle a significant portion of air traffic.2. United Airlines leads in flight delays at 53.3%, followed closely by Southwest at 51.4%. Spirit, JetBlue, and Frontier also show high delay percentages, ranging from 40.7% to 48.2%.3. Flight cancellations are primarily due to Weather issues (57.3%) and Airline/carrier (28.3%). National Air System-related reasons account for 14.4% of cancellations.4. Sunday appears to have the highest percentage of flight cancellations at 2.3%, with Saturday following at 1.7%. Other days of the week show lower cancellation rates.5. Overall, 58% of flights are on time, while 40.5% experience delays. Only 1.5% of flights are cancelled. This indicates that while most flights operate as scheduled, delays affect a significant portion of air travel.
Power BI
Store Sales Dashboard
Tools: Power BI, DAX, POWERQUERY
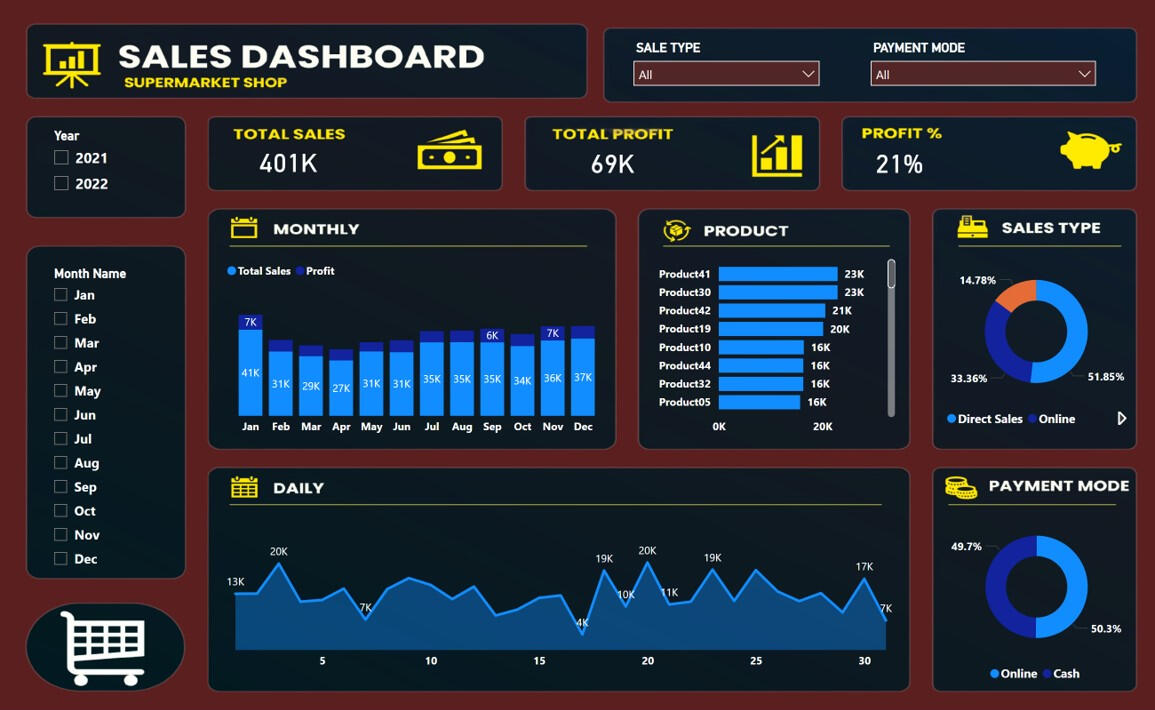
Dataset Link5 Key Questions:
1. How do total sales and profit vary across months and days?
2. Which products generate the highest sales?
3. What is the distribution of sales across direct sales and online channels?
4. How does the mode of payment impact sales performance?
5. How does profit percentage relate to total sales?Here are my takeaways:1. Monthly and daily sales trends show significant variation. January has the highest monthly sales at 41K, while March and April have the lowest at around 27K-29K. Daily sales fluctuate between 4K and 20K, with several peaks throughout the month.2. The top-selling products are Product41 and Product30, both generating 23K in sales. They're followed by Product42 (21K) and Product19 (20K). Other products like Product10, Product44, Product32, and Product05 all contribute 16K each to total sales.3. Sales channels show a clear preference for direct sales, accounting for 51.85% of total sales. Online sales make up 33.36% of the total, with the remaining portion likely attributed to other channels not specified in the image.4. Payment modes are fairly evenly split, with a slight preference for cash transactions. Cash payments account for 50.3% of sales, while online payments make up 49.7%. This balanced distribution suggests customers are comfortable with both payment methods.5. The overall profit percentage stands at 21%, with total sales of 401K resulting in a total profit of 69K. This indicates a healthy profit margin for the supermarket, though it's important to note that this percentage remains constant despite variations in monthly sales figures.
Tableau
Emergency Room Dashboard
Tools: Tableau, Excel
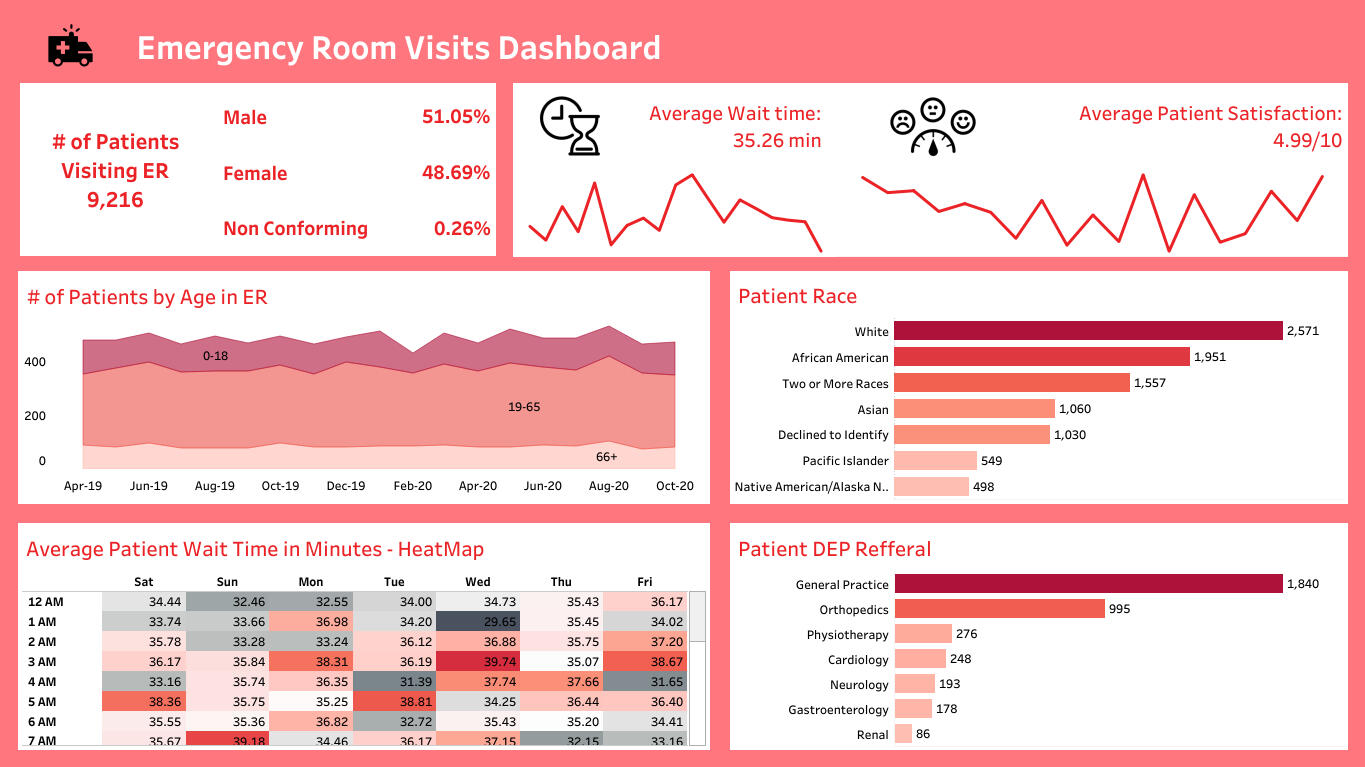
Dataset Link5 Key Questions:
1. How does the gender distribution of ER patients break down, and are there any notable trends?
2. What is the relationship between average wait time and patient satisfaction scores?
3. Which age group consistently accounts for the majority of ER visits, and how do the visit patterns change over time?
4. What are the top three racial demographics represented in ER visits, and how significant is the difference between them?
5. Which medical departments receive the most patient referrals from the ER, and what might this suggest about common health issues?Here are my takeaways:1. The gender distribution shows 51.05% male patients, 48.69% female patients, and 0.26% non-conforming patients. There's a slight majority of male patients, with a small but notable percentage identifying as non-conforming.2. The average wait time is 35.26 minutes, while the average patient satisfaction score is 4.99/10. This relatively low satisfaction score might be influenced by the wait time, though other factors are likely involved given the complexity of ER experiences.3. The 19-65 age group consistently accounts for the majority of ER visits from April 2019 to October 2020. The 0-18 age group is the second largest, followed by the 66+ group. The pattern appears relatively stable over time, with some minor fluctuations.4. The top three racial demographics are White (2,571 patients), African American (1,951 patients), and Two or More Races (1,557 patients). While White patients form the largest group, there's significant representation from other racial categories, indicating a diverse patient population.5. General Practice receives the most referrals (1,840), followed by Orthopedics (995) and Physiotherapy (276). This suggests that many ER visits may be for non-emergency issues that could be handled by general practitioners, while musculoskeletal problems (addressed by orthopedics and physiotherapy) are also common reasons for ER visits.
Tableau
British Airways Reviews Dashboard
Tools: Tableau, Excel
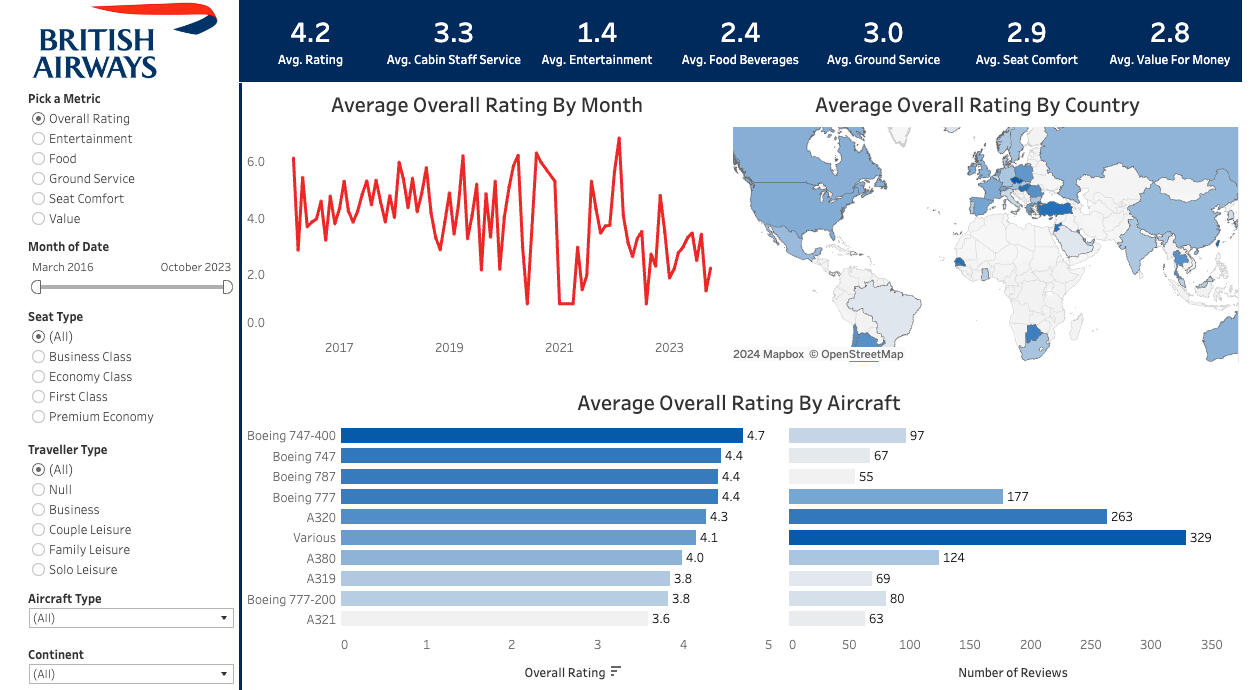
Dataset Link5 Key Questions:
1. What is the highest-rated aspect of British Airways' service, and how does it compare to the lowest-rated?
2. How has the overall rating trend changed from 2017 to 2023?
3. Which aircraft type receives the best customer ratings, and does this correlate with the number of reviews?
4. What insights can be drawn from the geographical distribution of ratings shown on the map?
5. How do the newer aircraft models (e.g., Boeing 787) compare in ratings to older models (e.g., Boeing 747-400)?Here are my takeaways:1. Cabin Staff Service is the highest-rated aspect at 3.3, significantly outperforming Entertainment, which scores lowest at 1.4. This suggests comparatively better service but a need to improve onboard entertainment options since it is rated out of 10.2. The overall rating trend shows high volatility from 2017 to 2023, with notable dips around 2021 and 2023. This could reflect service disruptions, possibly related to the global pandemic and its aftermath.3. The Boeing 747-400 receives the highest rating (4.7) despite having fewer reviews (97) than some other aircraft. This indicates that quantity of reviews doesn't necessarily correlate with higher ratings.4. The map suggests varying customer satisfaction across different countries, with some European and African nations showing darker blue (potentially higher ratings). However, the limited visible data makes it difficult to draw definitive conclusions about geographical trends.5. Newer aircraft like the Boeing 787 (4.4) rate well, but interestingly, the older Boeing 747-400 (4.7) outperforms it. This suggests that age of aircraft model alone doesn't determine customer satisfaction.
POWER BI
HR Attrition Analysis Dashboard
Tools: Power BI, DAX, PowerQuery
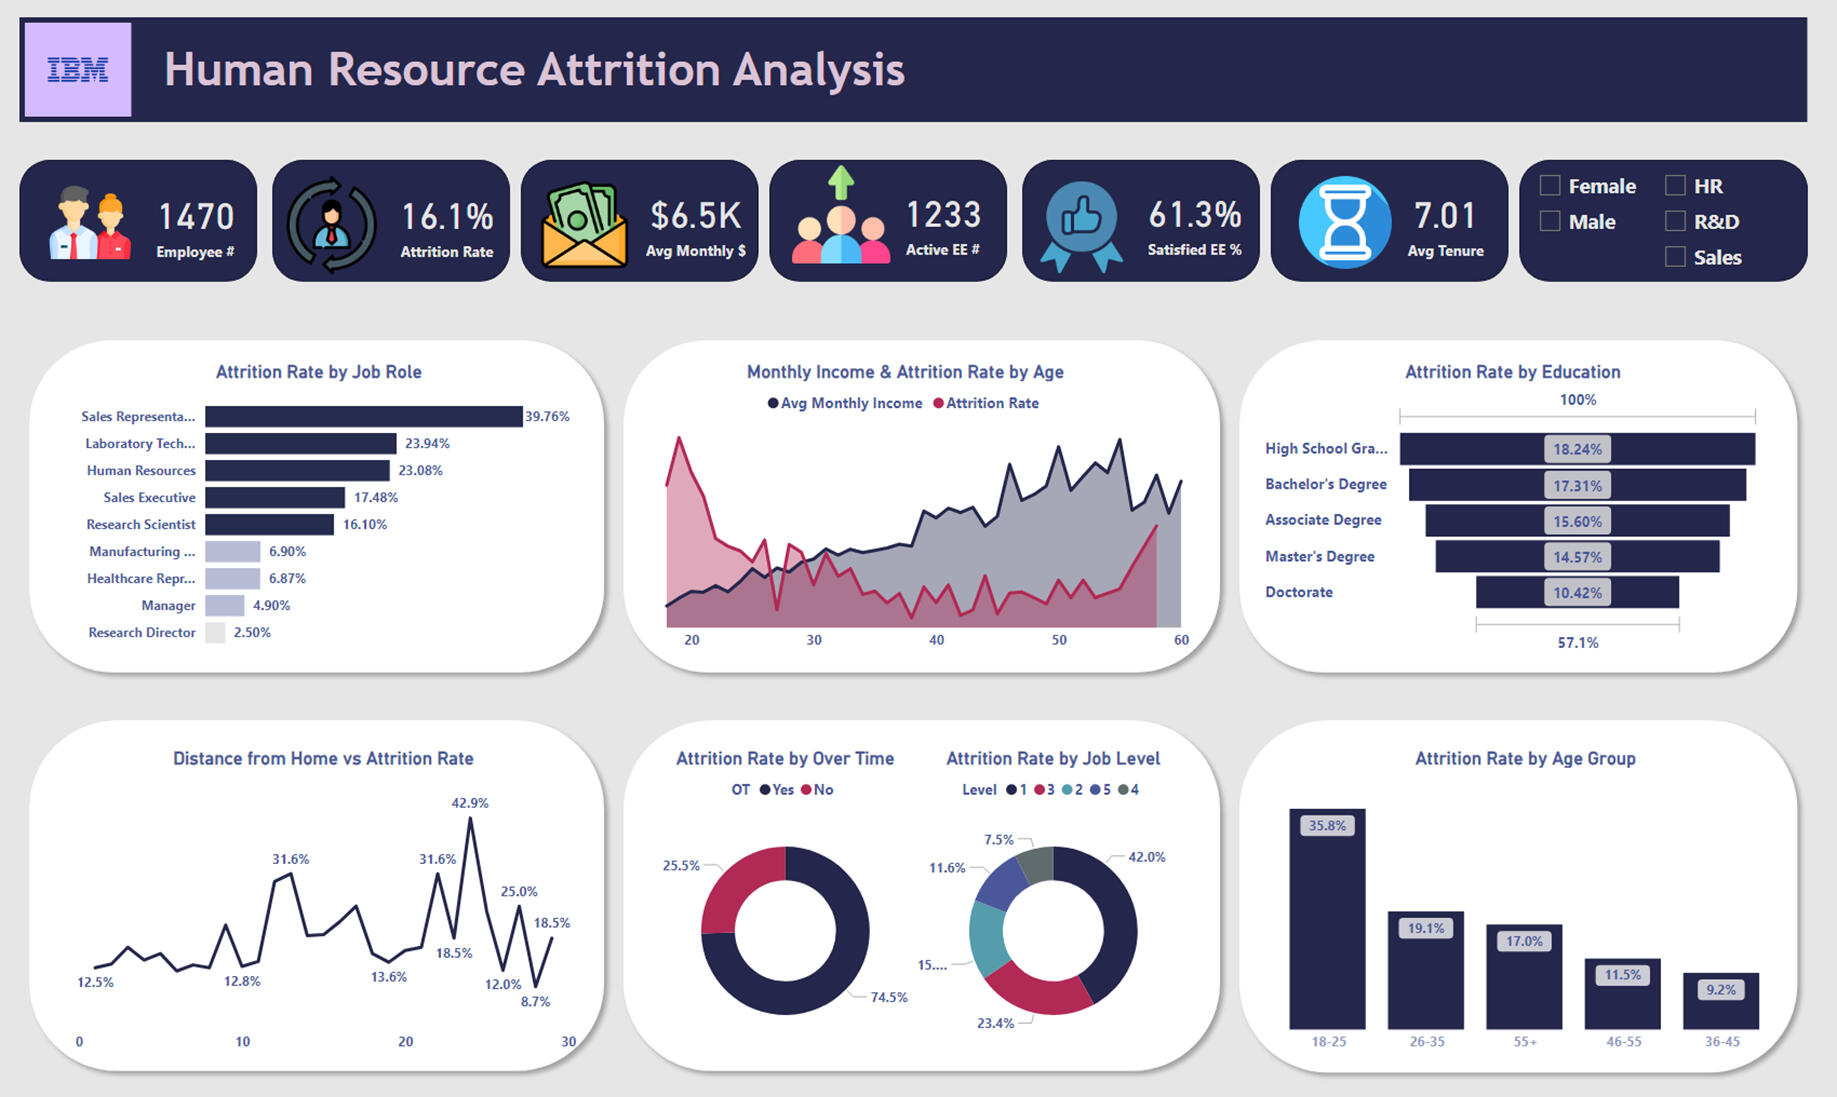
Dataset Link5 Key Questions:
1. Why is attrition highest among Sales Representatives (39.76%)?
2. Why does attrition decrease with education level?
3. Why is younger workforce (18-25) leaving at 35.8%?
4. What explains the 61.3% satisfaction rate despite high attrition?
5. How does distance from home impact retention?Here are my takeaways:1. Sales positions show the highest turnover at nearly 40%, likely due to high-pressure environments, commission-based pay structures, and competitive market conditions. The data suggests a need to reevaluate the sales department's work culture, compensation packages, and career development opportunities. Regular check-ins and improved support systems could help reduce this rate.2. Education shows a clear inverse relationship with attrition - from 18.24% for high school graduates to 10.42% for doctorate holders. This pattern suggests that higher education leads to more specialized roles, better job satisfaction, clearer career paths, and possibly better compensation packages. Investment in employee education could be a retention strategy.3. The 18-25 age group's high attrition (35.8%) reflects a broader trend of job-hopping among younger professionals. This generation prioritizes rapid career growth, work-life balance, and diverse experiences. Companies need stronger early-career development programs, mentorship opportunities, and clear advancement paths to retain young talent.4. The disconnect between high satisfaction (61.3%) and high attrition (16.1%) indicates that satisfaction alone doesn't ensure retention. External factors such as competitive job offers, career growth opportunities, work-life balance, and market conditions play crucial roles. This suggests the need for a more comprehensive retention strategy beyond job satisfaction.5. The distance-attrition relationship shows significant spikes (up to 42.9%) at certain distances, suggesting commute time significantly impacts retention. This data supports the case for hybrid work models, relocation assistance, or satellite office locations. Companies should consider flexible work arrangements to accommodate employees with challenging commutes.
Amazon Data Engineering Books ETL Project
Tools: Apache aIRFLOW, POSTGRESQL, DOCKER, PYTHON
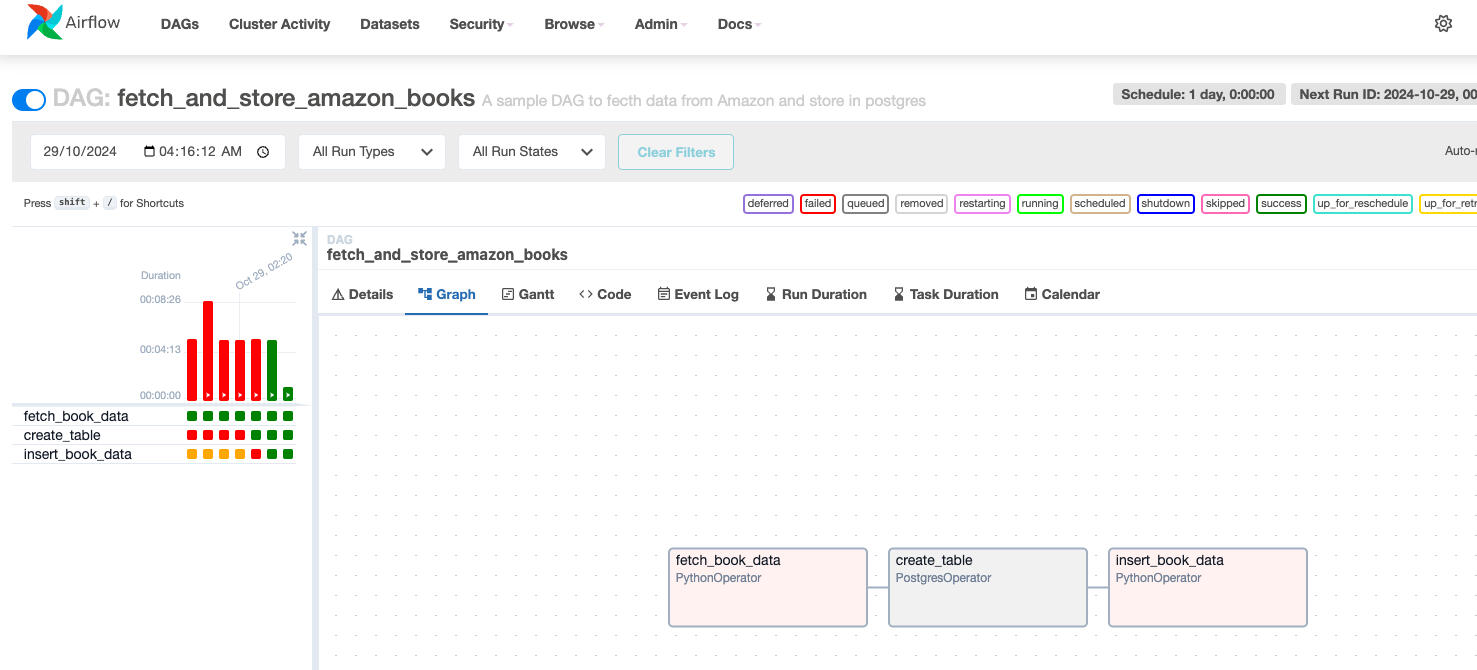
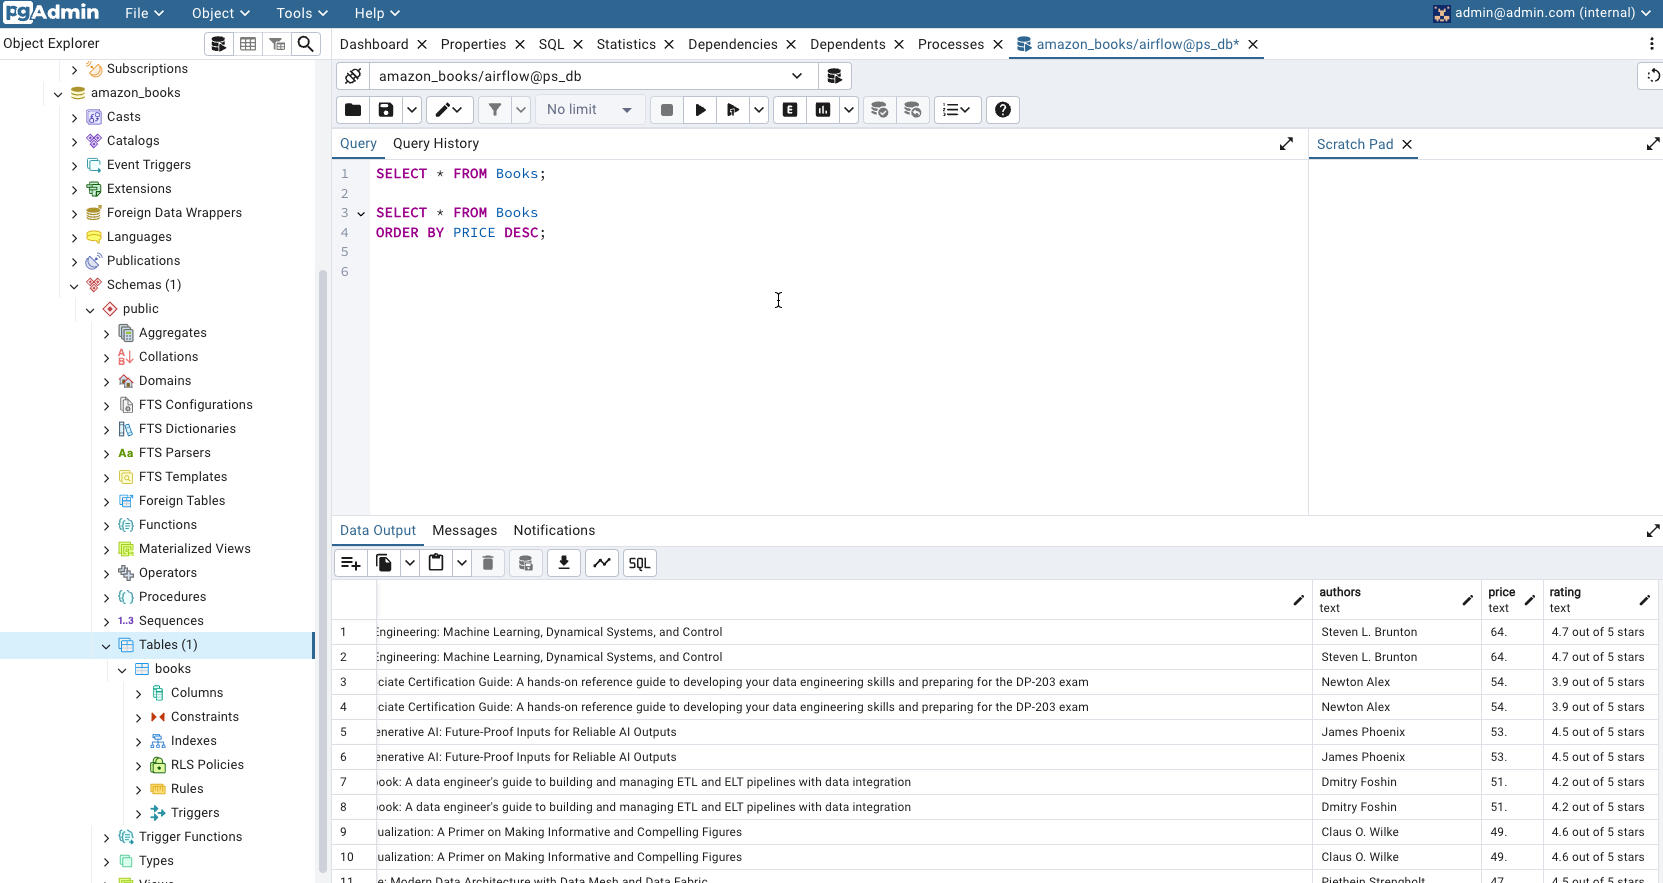
Complete Project LinkAmazon Data Engineering Books ETLThis project is an ETL (Extract, Transform, Load) pipeline that fetches data on Amazon's data engineering books, transforms the data, and loads it into a PostgreSQL database.Technologies Used1. Apache Airflow
2. Docker
3. PostgreSQL
4. PythonProject OverviewI've created an impressive ETL (Extract, Transform, Load) project using the following technologies:Apache Airflow: An open-source workflow orchestration platform used to programmatically author, schedule, and monitor data pipelines.
Docker: A containerization platform that allows me to package my application and its dependencies into a single, portable container.
PostgreSQL: An open-source relational database management system used as the destination for the data I'm extracting and transforming.
API: I've utilized API calls to fetch data on Amazon's data engineering books, which serves as the source data for my ETL process.
The key steps in my project are:Data Extraction: I'm using API calls to fetch data on Amazon's data engineering books. This represents the "Extract" step of the ETL process.Data Transformation: Once the data is extracted, I'm using SQL to clean the data by removing any trailing data and converting the data types to the appropriate format. This is the "Transform" step.Data Loading: The transformed data is then loaded into a PostgreSQL database, which represents the "Load" step.Orchestration with Apache Airflow: I'm using Apache Airflow to orchestrate the entire ETL process, allowing me to schedule, monitor, and manage the data pipeline.Docker Containerization: To ensure consistency and ease of deployment, I'm running the entire project within a Docker container.This comprehensive ETL solution allows me to regularly and reliably fetch data from the Amazon API, transform it, and load it into a PostgreSQL database for further analysis or reporting.FeaturesFetches data on data engineering books from the Amazon API.
Transforms the data by removing any trailing data and converting data types to the appropriate format.
Loads the transformed data into a PostgreSQL database.
Uses Apache Airflow to schedule, monitor, and manage the ETL process.
Runs the entire application within a Docker container for easy deployment and consistency.
Patient Centric Healthcare Database Project
Tools: SQL, SQL Flow, Oracle SQL Developer
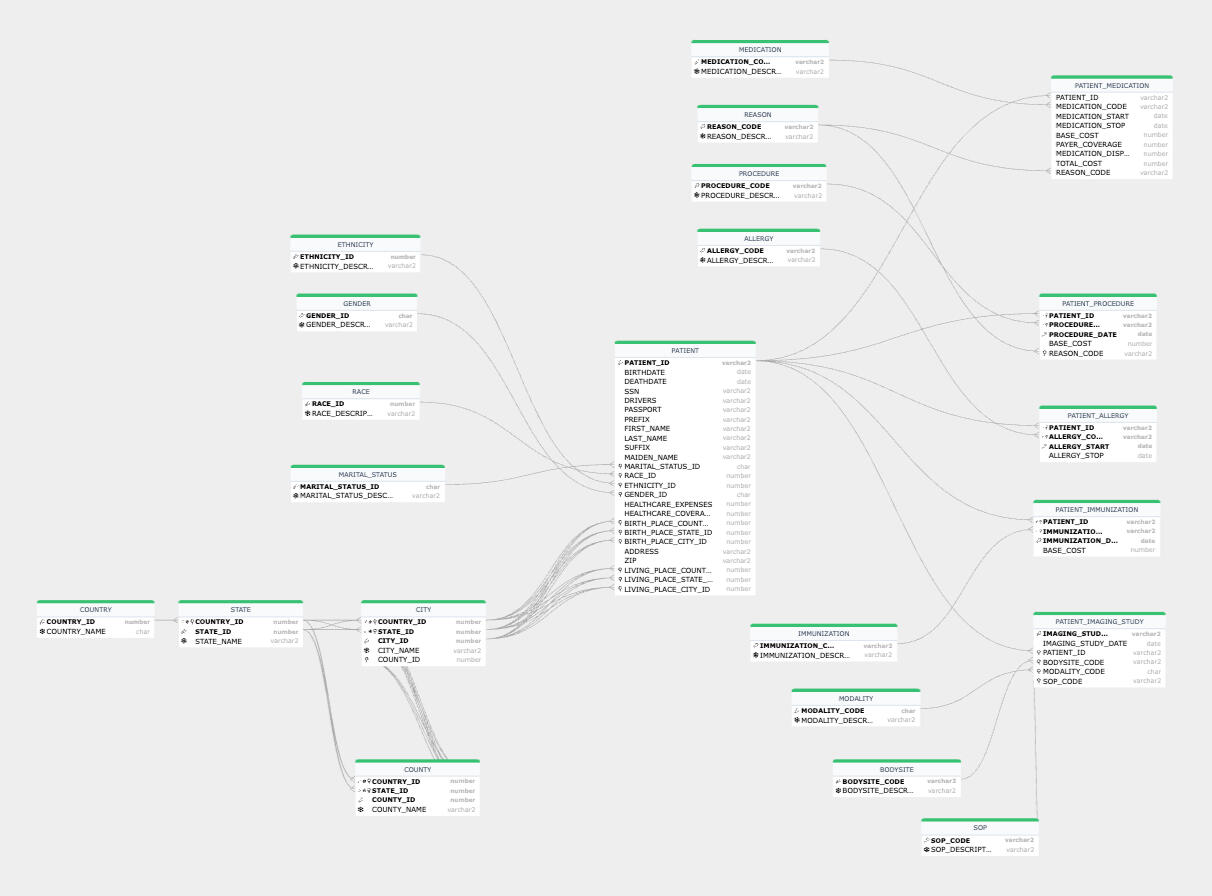
This ER diagram represents a patient-centric healthcare database, designed to track key information about patients and their medical history, treatments, and demographic details. Let me break it down:Key Entity: PATIENT
The central table is the PATIENT table, which captures essential details about each individual, such as:
Demographics: First name, last name, gender, race, ethnicity, marital status, and birthdate.
Contact information: ZIP code and details about their living place (country, state, and city).
Identification: SSN, passport number, or other identifiers.
Healthcare-specific fields: Insurance details, healthcare expenses, and coverage data.This table links to various other entities that expand upon the patient's demographics, conditions, and treatments.Supporting Tables for Demographics
1. GENDER, ETHNICITY, RACE, and MARITAL_STATUS:
These are reference tables providing descriptive information (e.g., "Male", "Asian", "Married").
Each patient in the PATIENT table is associated with entries in these tables through their respective IDs.2. COUNTRY, STATE, CITY, and COUNTY:
These tables provide geographical information about the patient's living or birth location.
Each links hierarchically, enabling detailed reporting and aggregation at different administrative levels.Medical History and Treatment
1. PATIENT_PROCEDURE:
Tracks procedures the patient has undergone.
Links to:
PROCEDURE: Describes the type of procedure (e.g., "Appendectomy").
REASON: Indicates the reason for the procedure (e.g., "Appendicitis").
Captures procedure dates and associated costs.2. PATIENT_MEDICATION:
Tracks medications prescribed to the patient.
Links to:
MEDICATION: A catalog of medications (e.g., "Aspirin").
REASON: Indicates why the medication was prescribed.
Includes details about start/stop dates, dosages, and costs.3. PATIENT_ALLERGY:
Tracks allergies the patient has.
Links to:
ALLERGY: A catalog of known allergens (e.g., "Peanuts").
Includes dates when the allergy was identified and its resolution (if any).4. PATIENT_IMMUNIZATION:
Tracks immunizations the patient has received.
Links to:
IMMUNIZATION: Describes the type of immunization (e.g., "Flu Shot").
Captures immunization dates and costs.5. PATIENT_IMAGING_STUDY:
Tracks imaging studies performed on the patient.
Links to:
MODALITY: Imaging modality used (e.g., "MRI").
BODYSITE: Indicates the body part being scanned.
Includes details like imaging study dates and associated procedure codes.Reference Tables for Medical Data
MEDICATION, PROCEDURE, ALLERGY, and IMMUNIZATION:
Maintain catalogs of medications, procedures, allergens, and immunizations for standardization.MODALITY and BODYSITE:
Provide descriptive details for imaging-related procedures.REASON:
Standardizes reasons for medical actions.Relationships and Key Points
The PATIENT table serves as the hub, connecting to various tables that capture more granular information about the patient's medical and demographic history.
Reference tables like GENDER, RACE, and COUNTRY ensure data consistency and allow flexibility for future expansion.
Relationships are clearly defined, such as:
One patient can have multiple procedures, medications, or immunizations.
Standardized codes (e.g., for medications or procedures) simplify data entry and reporting.This database is designed to be both scalable and HIPAA-compliant, supporting effective patient care, analytics, and reporting. Let me know if you'd like clarification on any specific area!
AI-Generated KPI Data Insights
Tools: Python, LLM, StreamLit, Ollama, Pandas, Numpy
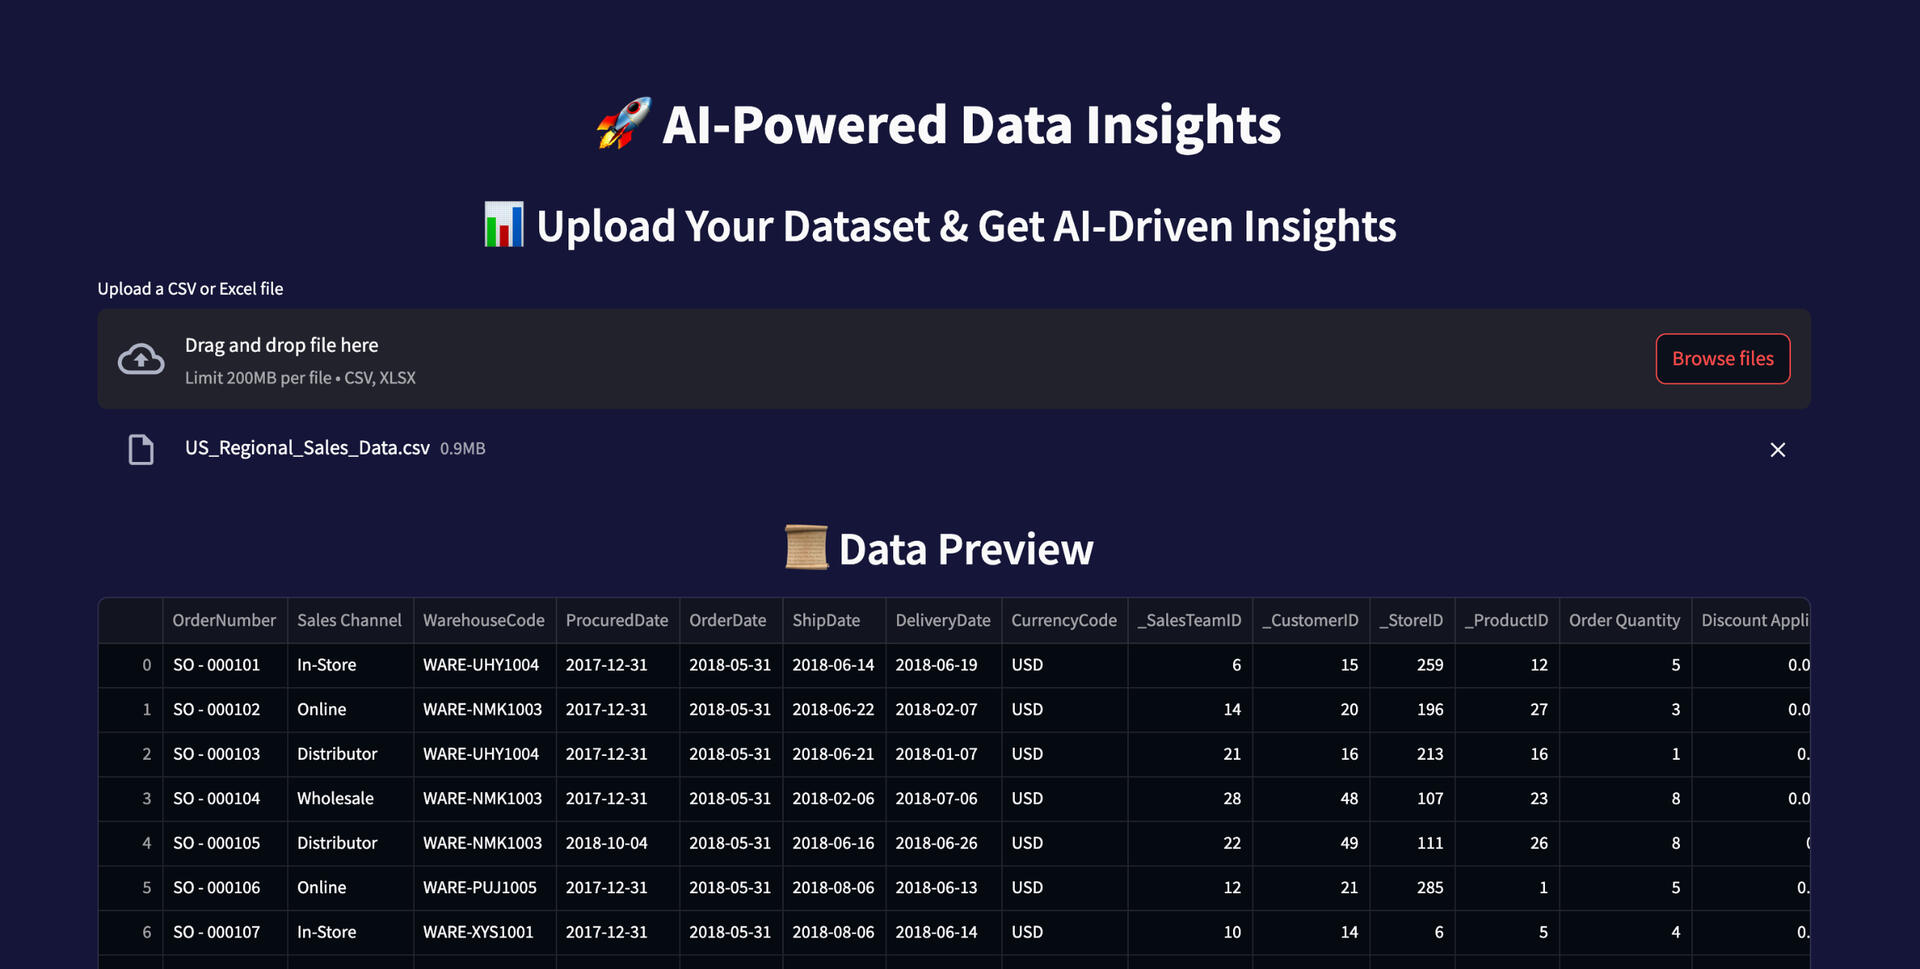
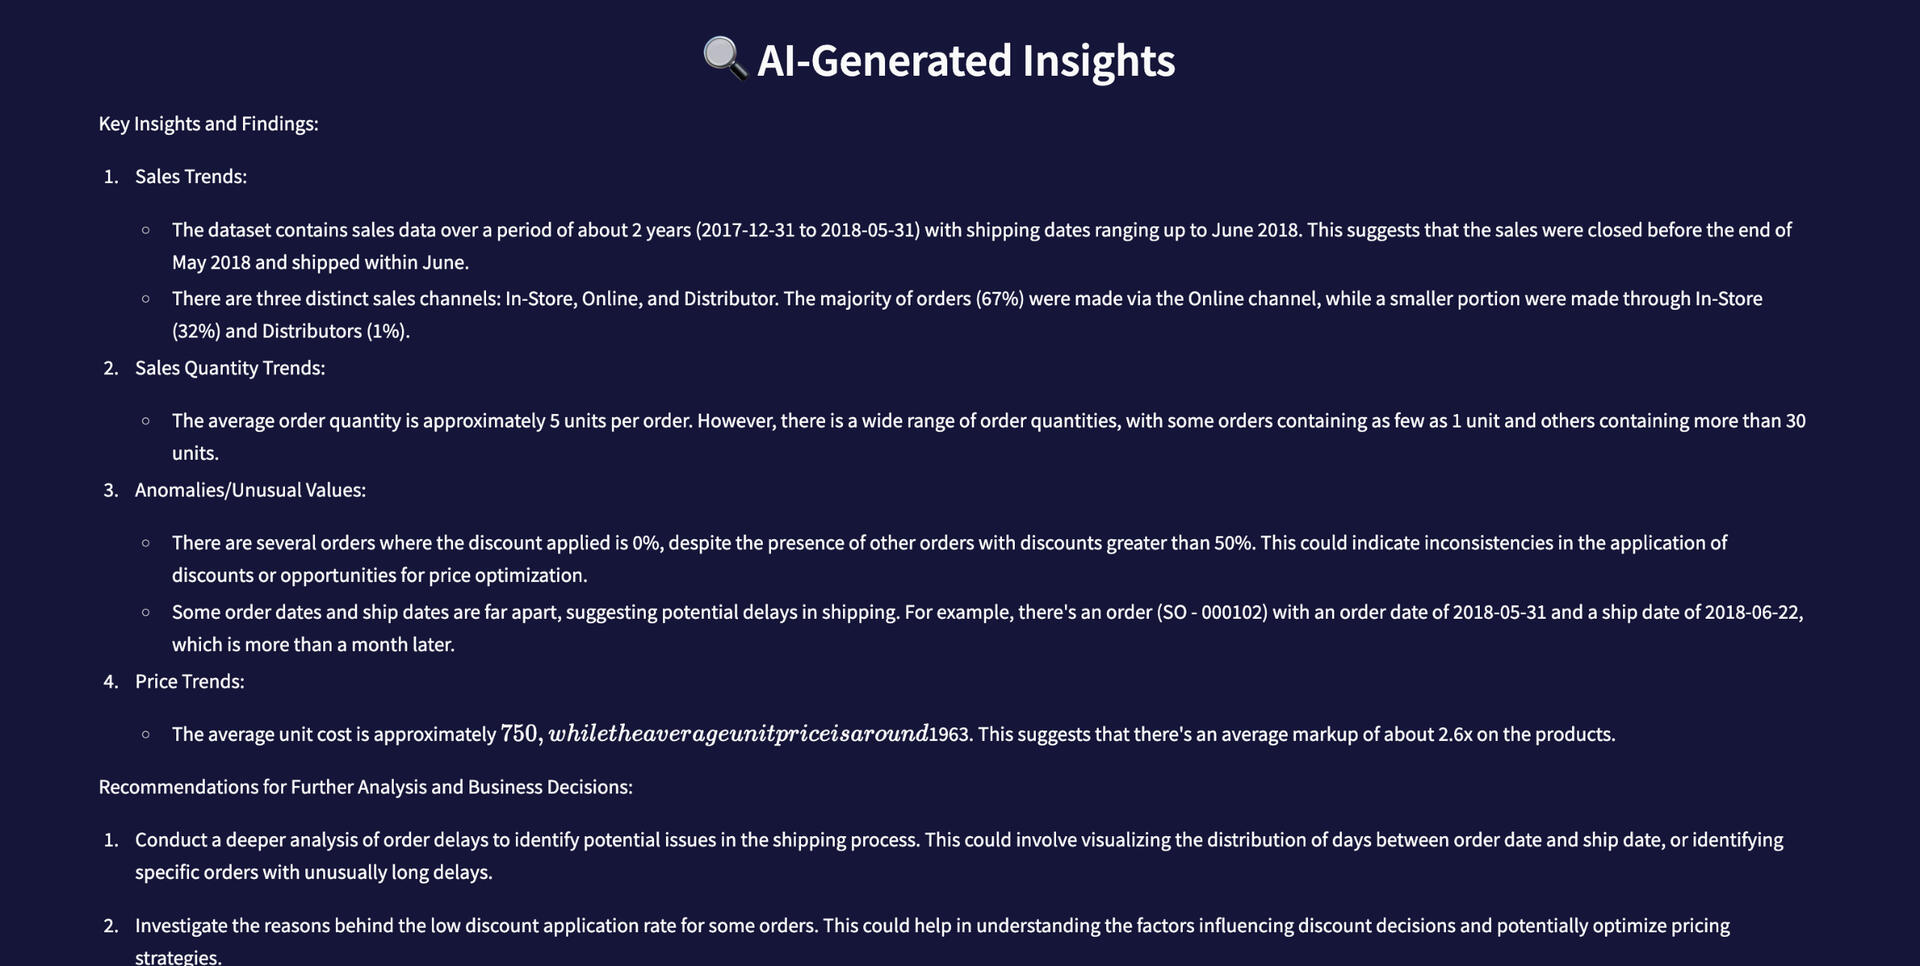
GitHub LinkThe LLM Powered Data Insights project is a cutting-edge tool designed to streamline data analysis and insight generation using the power of artificial intelligence. This application allows users to upload CSV or Excel datasets, which are then automatically cleaned, preprocessed, and analyzed. By leveraging LangChain’s Ollama model, the system intelligently identifies key trends, anomalies, and patterns within the data, offering users data-driven recommendations for better decision-making.A key feature of this project is its automated data preprocessing. It removes duplicates, fills missing values with appropriate replacements (such as median for numerical data and “Unknown” for categorical data), and correctly formats boolean, datetime, categorical, and numerical columns. This ensures that the dataset is clean, consistent, and ready for AI analysis.The AI then generates detailed insights by analyzing time-series patterns, numerical distributions, and categorical trends. It highlights important KPIs, detects outliers, and suggests potential actions for better business or research outcomes. Unlike traditional analytics tools that require manual effort, this project delivers instant insights without complex coding or statistical knowledge.The application is built using Streamlit, offering an intuitive, modern UI with a sleek purple-themed design. Users can preview the first 10 rows of their cleaned dataset and receive structured AI-generated insights in real time. Additionally, the project is designed to be lightweight and easily deployable, with an option to host it on Streamlit Cloud for web-based access.Ideal for business analysts, researchers, and data enthusiasts, this project removes the technical barriers of data analysis while enhancing efficiency and accuracy. With future expansions planned, including AI-driven visualizations and automated column labeling, this project is a significant step toward simplifying AI-powered data exploration. 🚀


